AI Gateway

Open the Logs tab in the AI Gateway sidebar. It's available at two scopes:
Observability and Spend
The public REST API does not expose the Logs page's list and filter query. To look up one completed generation by ID, use GET /v1/generation or the AI SDK's getGenerationInfo() workflow. Generation lookup returns provider, latency, token usage, cost, and finish reason.
Logs
The Logs page lists every request and asynchronous job your team sends through AI Gateway, newest first. Use it to find one operation by ID, narrow the list by model or outcome, watch traffic as it arrives, and inspect routing, usage, and cost.
Copy page
For aggregate charts and spend totals, see Observability. For usage grouped by model, user, or tag, see Custom Reporting.
Programmatic access
To send routing attempts and error fields for every request to an observability backend, configure AI Gateway Trace Drains. Use the dashboard export for an ad hoc CSV or JSON file of the request rows currently loaded under your filters.
AI Gateway Request Logs
- Team: every request and asynchronous job across your team, at /[team]/~/ai-gateway/logs
- Project: only that project's logs, at /[team]/[project]/ai-gateway/logs
The two views behave identically. The project view is the team view with a project filter applied.
Each row is one request or asynchronous job. The table scrolls horizontally when the available width can't fit every column, including when request details are open.
Our Services
Column
Time
Status
When the request started or job was submitted. Hover for the full timestamp
Provider
HTTP status code for a request, or lifecycle state such as Completed or Cancelled for a job
Model
Brand & Design
Usage
The model that served the request, including its speed tier
The provider that served the request
What it shows
What the request consumed, in the unit that suits its modality
Duration
Authentication
Cost
Total request duration, or elapsed job time from submission to completion
The AI Gateway API key, project, app token, or personal access token that authenticated the call
Total cost in dollars
Usage holds one slot per row and changes what it reports based on the model's modality:
Modality
Language
Embedding
Image
Usage reads
4 images
1.7K → 233 tokens, everything read then written
23 tokens in, since embeddings return vectors
Video
Reranking
Audio duration
Query count
Count, duration, and resolution
Session duration and client message count
Hover a Usage cell for the long form, which names the components. For language models that means the input and cache-read halves of the left figure, and the reasoning and output halves of the right.
A dash means the request reported nothing for that column. A request that failed before reaching a provider shows one for both Usage and Cost.
Running asynchronous jobs appear first. The remaining rows are ordered newest first, and the list can't be re-sorted. To narrow it, use the filters below.

Filter logs
The filter bar sits above the table.
Search matches the model, provider, or request ID. Enter an exact job ID to find an asynchronous job.
Dropdowns each accept multiple values:
Filter
Status
Model
Provider
Response outcomes by 2xx, 4xx, 5xx, or an exact status code such as 429
The model that handled the request or job
The provider that served the model
Authentication
Routing
Modality
The API key, project OpenID Connect (OIDC) token, app token, or personal access token that authenticated the operation
What it filters
The model's input or output type, such as Language, Embedding, Image, or Video
Synchronous requests or asynchronous jobs
Latency
Tokens
Cost
Request Mode
Input or output token count
Inference cost
Date range offers presets from the last 5 minutes to the last 30 days. You can look back at most 36 days.
Every filter is stored in the URL, so you can share a filtered view by copying the address. Reset clears the search and filters.
The chart above the table shows token volume under the same filters. When matching operations report no token usage, the chart shows request volume instead. If the range contains no requests, the chart shows an empty state. Drag across a populated chart to select that time range and zoom into a finer granularity.
Follow logs live
Turn on Live to tail logs as they arrive. New rows appear at the top, refreshing every 5 seconds.
Live mode has three limits worth knowing:
- It only works with a relative range. Turning it on while an absolute range is selected switches you to the last hour.
- Scrolling back through history is disabled while live. Pause to load older logs.
- Requests take about 90 seconds to fully ingest, so the newest rows lag real time by roughly that much.
With Live off, the list loads 50 more rows each time you scroll to the bottom.
Inspect a log
Click any row to open its details beside the list. The panel is resizable by dragging its left edge. The selected log ID is stored in the URL, so you can copy the address to share the same log and filtered list.
A request's details panel with a Routing card per provider attempt.
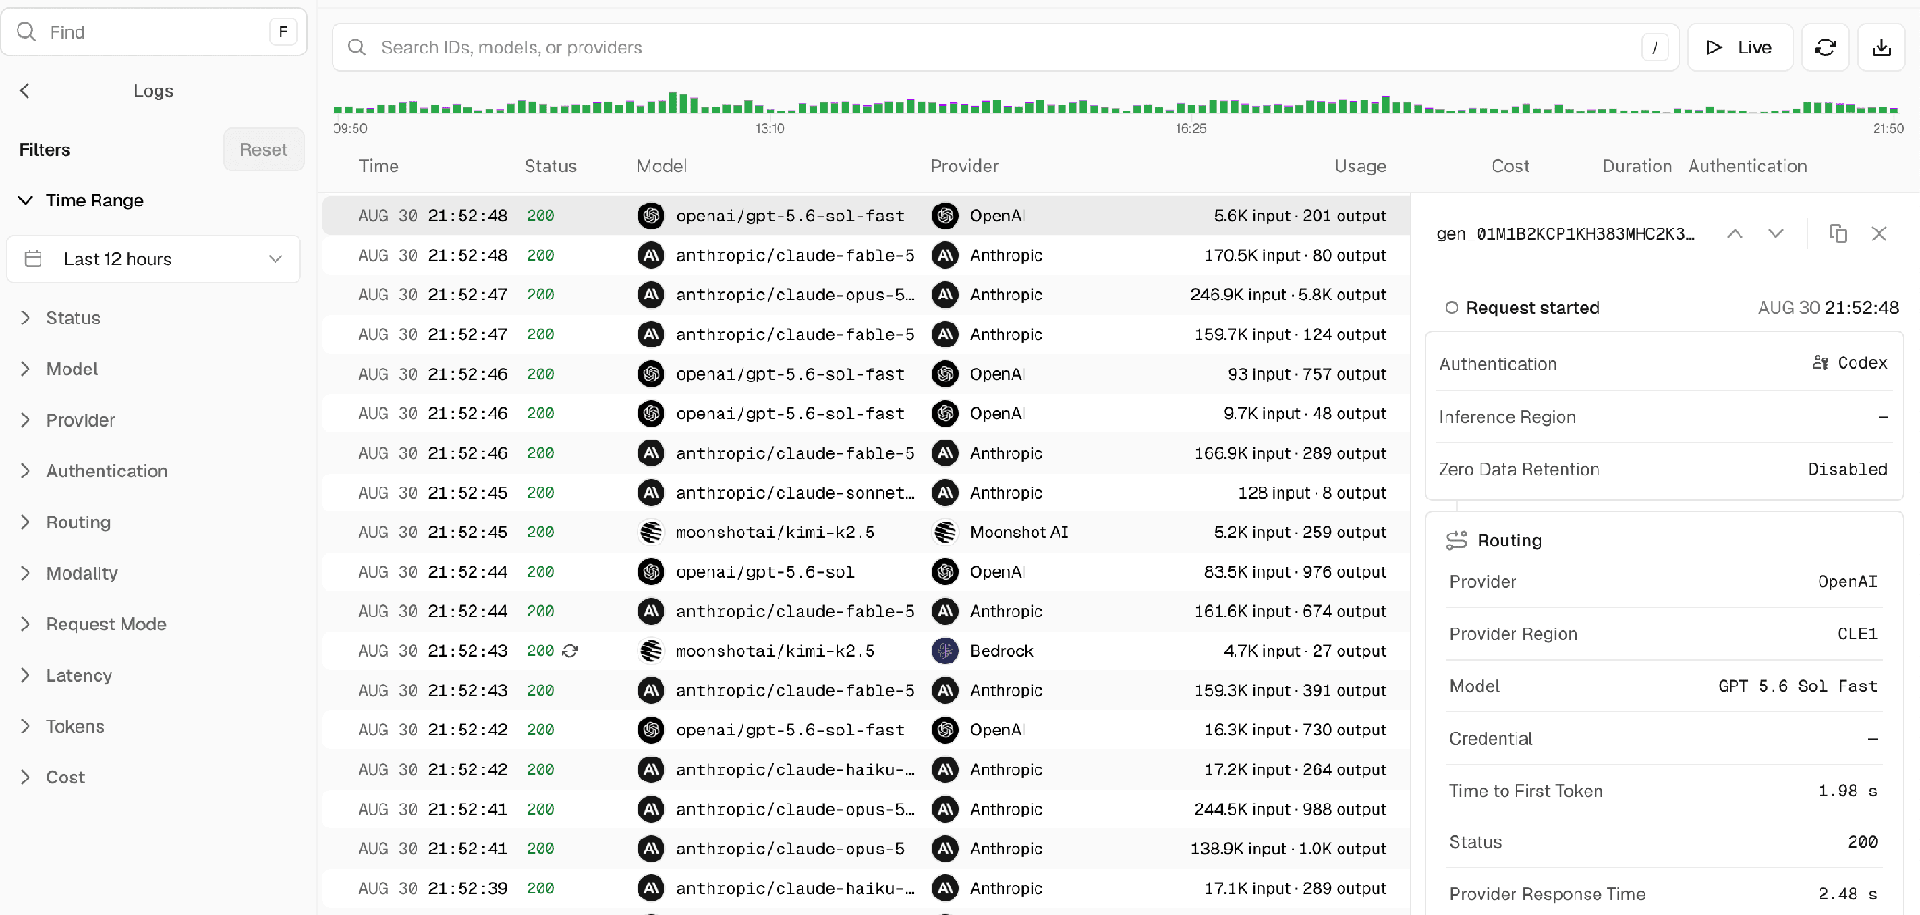
The header carries the generation or job ID with a copy button. Request started identifies the authentication input, inference region, and whether Zero Data Retention applied. OIDC-authenticated requests name their project because the token itself has no API key name. App tokens and personal access tokens appear as team-scoped authentication.
Routing describes what happened after AI Gateway received the request. A single provider attempt appears in one Routing card. A request that needed multiple attempts shows one Routed to [provider] card per attempt. Each card can include the provider, provider region, served model, credential source, time to first token, compact timing spans, status, and provider response.
Timing spans use green for successful work, amber for a 4xx response, and red for a 5xx response or timeout. A recovered request also has a refresh icon in the table's Status cell.
Usage and Cost break the request down line by line, so you can see which tokens and which charges made up the total.
Use the Request Mode filter to show asynchronous jobs, or search for an exact job ID. Click a job to open its details beside the list:

Feature Three
A running asynchronous video job with its job details open beside the log table.
Export logs
Roles and permissions
Last updated September 11, 2026
Cross-link map: AI Gateway Request Logs (/docs/ai-gateway/observability-and-spend/logs)From the Vercel docs graph (built 2026-09-21T05:26:59.511Z), spanning vercel.com docs + KB, nextjs.org, ai-sdk.dev, and other Vercel documentation sites. Full graph as JSON: https://vercel.com/docs/graph.jsonSemantically closest pagesAI Gateway Observability — Monitor AI Gateway requests in the Vercel dashboard. Inspect token usage, latency, spend, and logs at team, project, andRuntime Logs — Learn how to search, inspect, and share your runtime logs with the Logs tab.AI Gateway logs now have a dedicated pageAI Gateway Observability and Spend — Monitor AI Gateway requests and control costs with logs, generation lookup, custom reporting, budgets, and OpenTelemetryAI Gateway FAQ — Answers to common questions about AI Gateway, including request errors, pricing and markup, SDK and API compatibility, mThis page links to (5)AI Gateway Custom Reporting API — Query AI Gateway usage data grouped by model, user, tag, provider, or credential type using the Custom Reporting API.AI Gateway Observability — Monitor AI Gateway requests in the Vercel dashboard. Inspect token usage, latency, spend, and logs at team, project, andAI Gateway Trace Drains — Forward an OpenTelemetry trace of every AI Gateway request to your own observability tool, and understand trace drain biAI Gateway Generation Lookup and Usage API — Look up an AI Gateway generation by ID to inspect its provider, latency, token usage, cost, and finish reason, or checkAI Gateway REST API Reference — Reference for AI Gateway REST endpoints: models, usage, generations, and reporting.Pages that link here (18)By site: vercel-changelog (3) · vercel-kb (1) · vercel-docs (14)From vercel-changelogAI Gateway logs now have a dedicated pageSet up coding agents in one command with AI GatewayTypeSafe AI's Jev now available on AI GatewayFrom vercel-kbHow to classify, route, and score with Jev and AI SDK — Use Jev from TypeSafe AI with AI SDK's experimental \evaluate\\ API to classify, route, score, and verify inside your aFrom vercel-docsVercel AI Gateway: Models, Routing, and Observability — Call AI models from any infrastructure through a managed gateway. Centralize credentials, request logs, spend budgets, rAmp with AI Gateway — Connect Amp to AI Gateway through Amp's Model Routing settings. Add an AI Gateway API key, choose models for Amp's modesCommand Code with AI Gateway — Connect Command Code to AI Gateway with your own API key and a custom base URL. Configure models, switch between them, aAI Gateway FAQ — Answers to common questions about AI Gateway, including request errors, pricing and markup, SDK and API compatibility, mAI Gateway Audio Input — Analyze recorded audio with AI Gateway, compare audio input with transcription and realtime voice, and choose a supporteAI Gateway File and PDF Input — Send PDFs and documents to AI Gateway models with examples for each supported SDK and API format.AI Gateway Video Input — Analyze video clips with AI Gateway using AI SDK 7, Python, Chat Completions, and Responses / OpenResponses.AI Gateway Vision and Image Input — Analyze images with AI Gateway using AI SDK 7, the Python beta, Chat Completions, Messages, and Responses APIs.AI Gateway Model Fallbacks — Configure AI Gateway model fallbacks to try backup models when the primary model is unavailable. Set fallback order andAI Gateway Reasoning — Discover model reasoning capabilities and configure effort across AI SDK, Chat Completions, Messages, and Responses withAI Gateway Service Tiers — Control processing priority and cost for OpenAI, Google AI Studio, Google Vertex AI, and SpaceXAI models using service tAI Gateway Observability and Spend — Monitor AI Gateway requests and control costs with logs, generation lookup, custom reporting, budgets, and OpenTelemetryAI Gateway Observability — Monitor AI Gateway requests in the Vercel dashboard. Inspect token usage, latency, spend, and logs at team, project, andAI Gateway Generation Lookup and Usage API — Look up an AI Gateway generation by ID to inspect its provider, latency, token usage, cost, and finish reason, or check
Running asynchronous jobs stay at the top of the table so you can monitor them until they complete, fail, or are canceled. The timeline identifies when AI Gateway submitted the job. The details include its authentication, model, provider, and inference region.
Custom Reporting
Routing attempt details are kept for 30 days. Older requests still appear in the list but open with a message saying their routing details are no longer available.
Was this helpful?
Viewing logs requires read access to your team's usage. Team roles without it see a permission message in place of the table rather than an empty list.


