
Session Tracing
Session tracing
With session tracing, you can use the Vercel toolbar to trace your own browser session and view the corresponding spans in the logs dashboard. Use it for targeted, interactive debugging when you want to trace a specific flow you're clicking through.
Session tracing complements always-on tracing, which continuously collects sampled traces from your production and preview traffic. Use session tracing when you want to trace only your own requests, without turning on collection for everyone.
A session trace is initiated through the Vercel toolbar, either through a Page Trace or a Session Trace. It is active for the person who initiated the trace on their browser indefinitely, until it is stopped or cookies are cleared.
Prerequisites
- A Vercel account. If you don't have one, you can sign up for free.
- A Vercel project that is deployed to preview or production. You cannot create and run a session trace for a local deployment.
- The toolbar enabled in your preview or production environment.
Run a session trace
- In the Vercel toolbar on your deployment, click (or search for) Tracing.
- Select Start Tracing Session. Once enabled, the page will reload to activate the session trace.
- From the toolbar, you can then using the Tracing icon to select any of the following options:
- View Page Trace: View the trace for the current page. Selecting this option will open the trace for the current page in a new tab. This is the same as running a page trace.
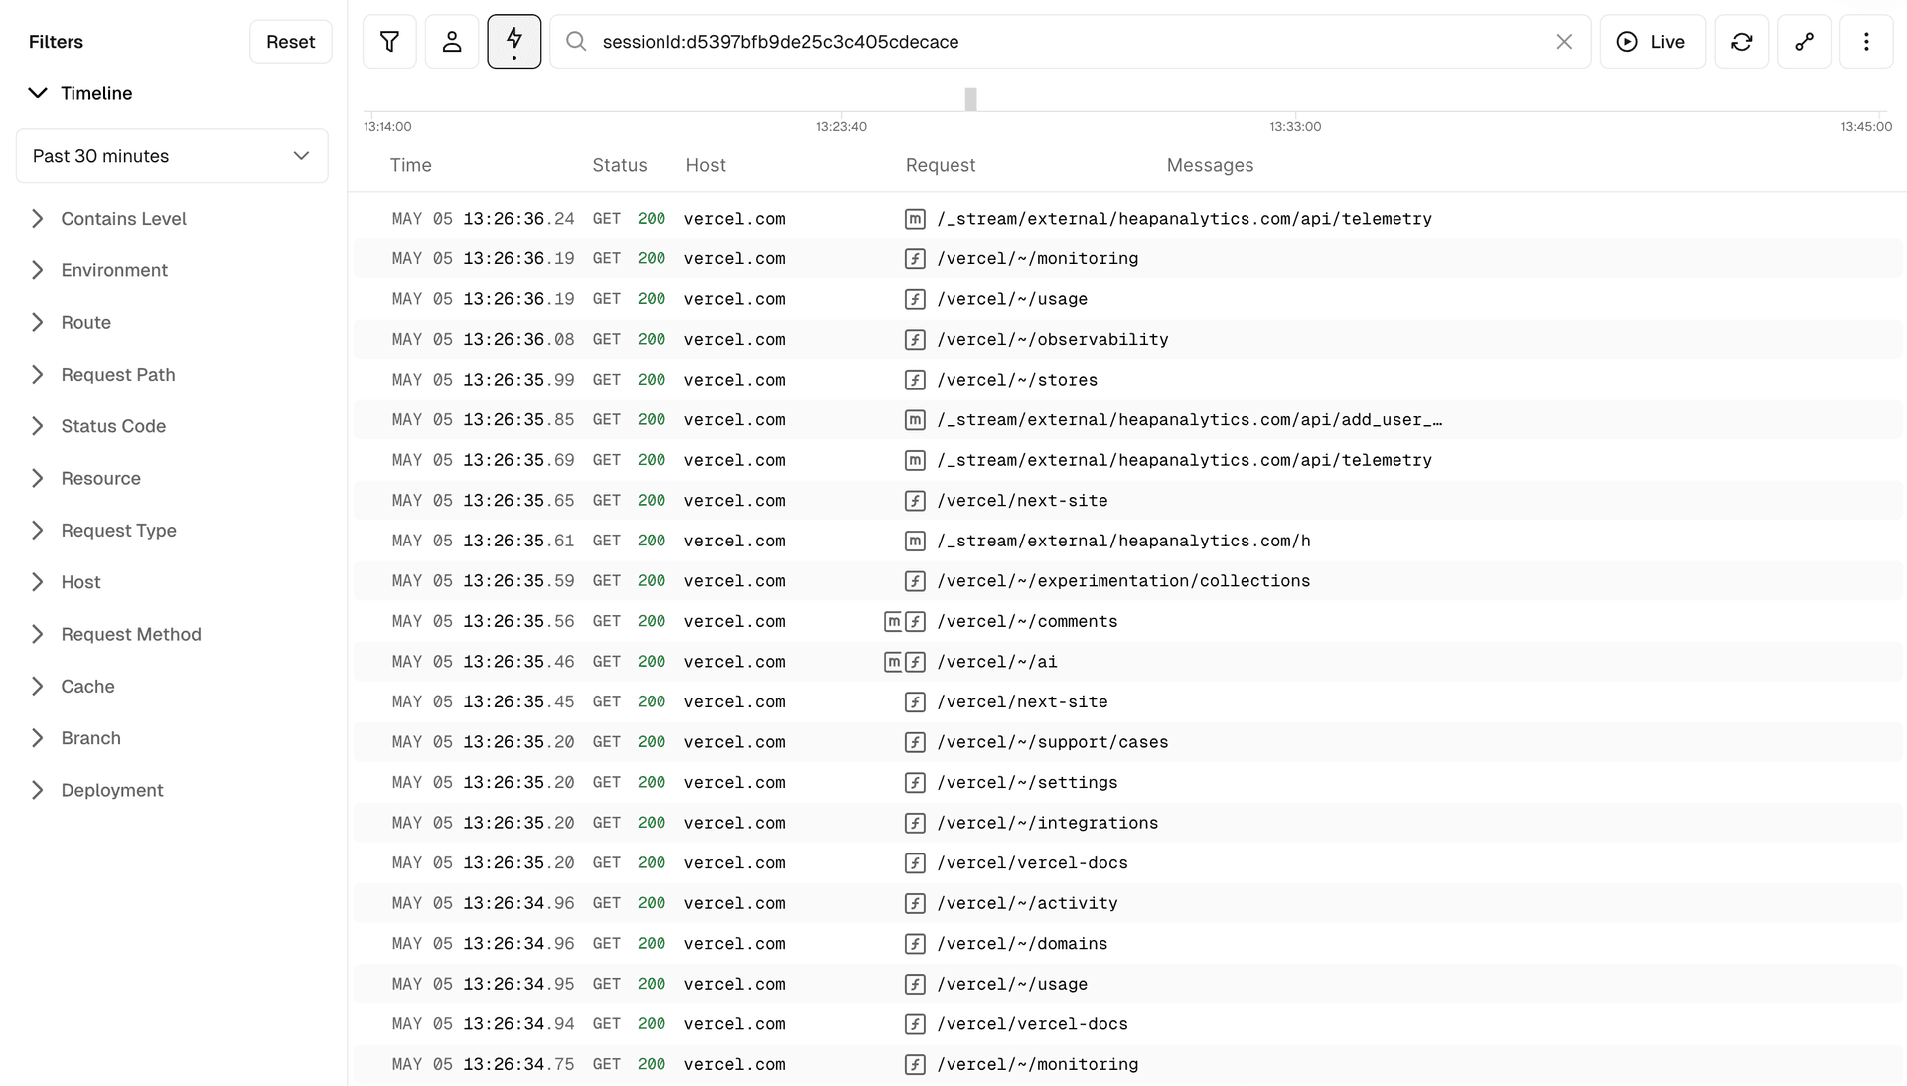
- View Session Traces: View all traced requests from your active session. Selecting this option will open the dashboard to the Logs section in the sidebar, filtered to the session ID, and the tracing filter applied.
- Stop Tracing Session: Stop tracing the current session.
- Restart Tracing Session: Restart tracing the current session.
View session trace options in the toolbar.
Run a page trace
To run a trace on a specific page, you can run a Page Trace:
- In your deployment, open the Vercel toolbar and scroll down to Tracing.
- Select Run Page Trace.
- The page will reload, and a toast will indicate the status of the trace. Once the trace has propagated, the toast will indicate that the trace is complete and ready to view.
- Click the toast to view the trace in a new browser section in the sidebar under the Logs section in the sidebar of the dashboard.
Run a trace from the Vercel CLI
To capture a trace for a single request from the terminal, use the vercel curl command with the --trace option. This is helpful for debugging API endpoints from scripts or capturing traces from CI workflows:

vercel curl--trace/api/hello
Once the request completes, the CLI prints a vercel traces get command with the trace's request ID. Run it to inspect the trace in your terminal, or add --open to view it in the dashboard:
vercel tracesgetreq_1234567890
vercel tracesgetreq_1234567890--open
See the vercel curl and vercel traces reference pages for all available options.
View previous session traces
- In the Vercel toolbar on your deployment, click (or search for) Tracing.
- Select View Previous Session Traces.
- The dashboard will open to the Logs section in the sidebar, filtered to the session ID, and the tracing filter applied - indicated by the Traces icon

You can filter traces using all the same filters available in the Logs section in the sidebar of the dashboard. To view traces for requests to your browser, press the user icon next to the Traces icon.
View previous session traces in the dashboard.
Plan
Hobby
Usage and pricing
Once a trace is open, you can switch between Timeline, Tree, and Waterfall views to explore the same spans in different layouts.
Attribute truncation
Monthly Session Tracing span limit per team
Pro
Enterprise
1 million
1 million
1 million
Session Tracing is available on all plans with a limit of 1 million spans per month, per team. This limit is separate from Always-on Tracing usage.
Limitations
Last updated August 28, 2026
Session Tracing follows the shared Tracing limitations.
Session Tracing follows the shared attribute truncation behavior.
Cross-link map: Session tracing (/docs/tracing/session-tracing)From the Vercel docs graph (built 2026-09-21T05:26:59.511Z), spanning vercel.com docs + KB, nextjs.org, ai-sdk.dev, and other Vercel documentation sites. Full graph as JSON: https://vercel.com/docs/graph.jsonSemantically closest pagesTracing — Learn how to trace your application to understand performance and infrastructure details.Always-on Tracing — Continuously collect traces from your production and preview traffic using sampling rules, so you can debug real requestTrack a request's full lifecycle with session tracingTrace any Vercel request from the CLIAlways-on tracing for production and preview trafficPrerequisitesTracing — Learn how to trace your application to understand performance and infrastructure details.This page links to (8)vercel curl — Learn how to make HTTP requests to your Vercel deployments with automatic deployment protection bypass using the vercelvercel traces — Inspect a request trace in the terminal, open it in the Vercel Dashboard, or manage the trace sampling rules for a projeRuntime Logs — Learn how to search, inspect, and share your runtime logs with the Logs tab.Observability — Find production errors, capture request traces, and discover queryable metrics with Vercel Observability and Vercel CLI.Tracing — Learn how to trace your application to understand performance and infrastructure details.Always-on Tracing — Continuously collect traces from your production and preview traffic using sampling rules, so you can debug real requestVercel Toolbar — Learn how to use the Vercel Toolbar to leave feedback, navigate through important dashboard pages, share deployments, usAdd the Vercel Toolbar to local and production environments — Learn how to use the Vercel Toolbar in production and local environments.Pages that link here (7)By site: vercel-changelog (2) · vercel-kb (1) · vercel-docs (4)From vercel-changelogAlways-on tracing for production and preview trafficTrace any Vercel request from the CLIFrom vercel-kbAdd structured application logs to Vercel Functions — Learn how to add structured application logs to Vercel Functions to help troubleshoot function issues in real time.From vercel-docsTesting & troubleshooting microfrontends — Learn about testing, common issues, and how to troubleshoot microfrontends on Vercel.Tracing — Learn how to trace your application to understand performance and infrastructure details.Always-on Tracing — Continuously collect traces from your production and preview traffic using sampling rules, so you can debug real requestInstrumentation — Learn how to instrument your application to understand performance and infrastructure details.
Was this helpful?


